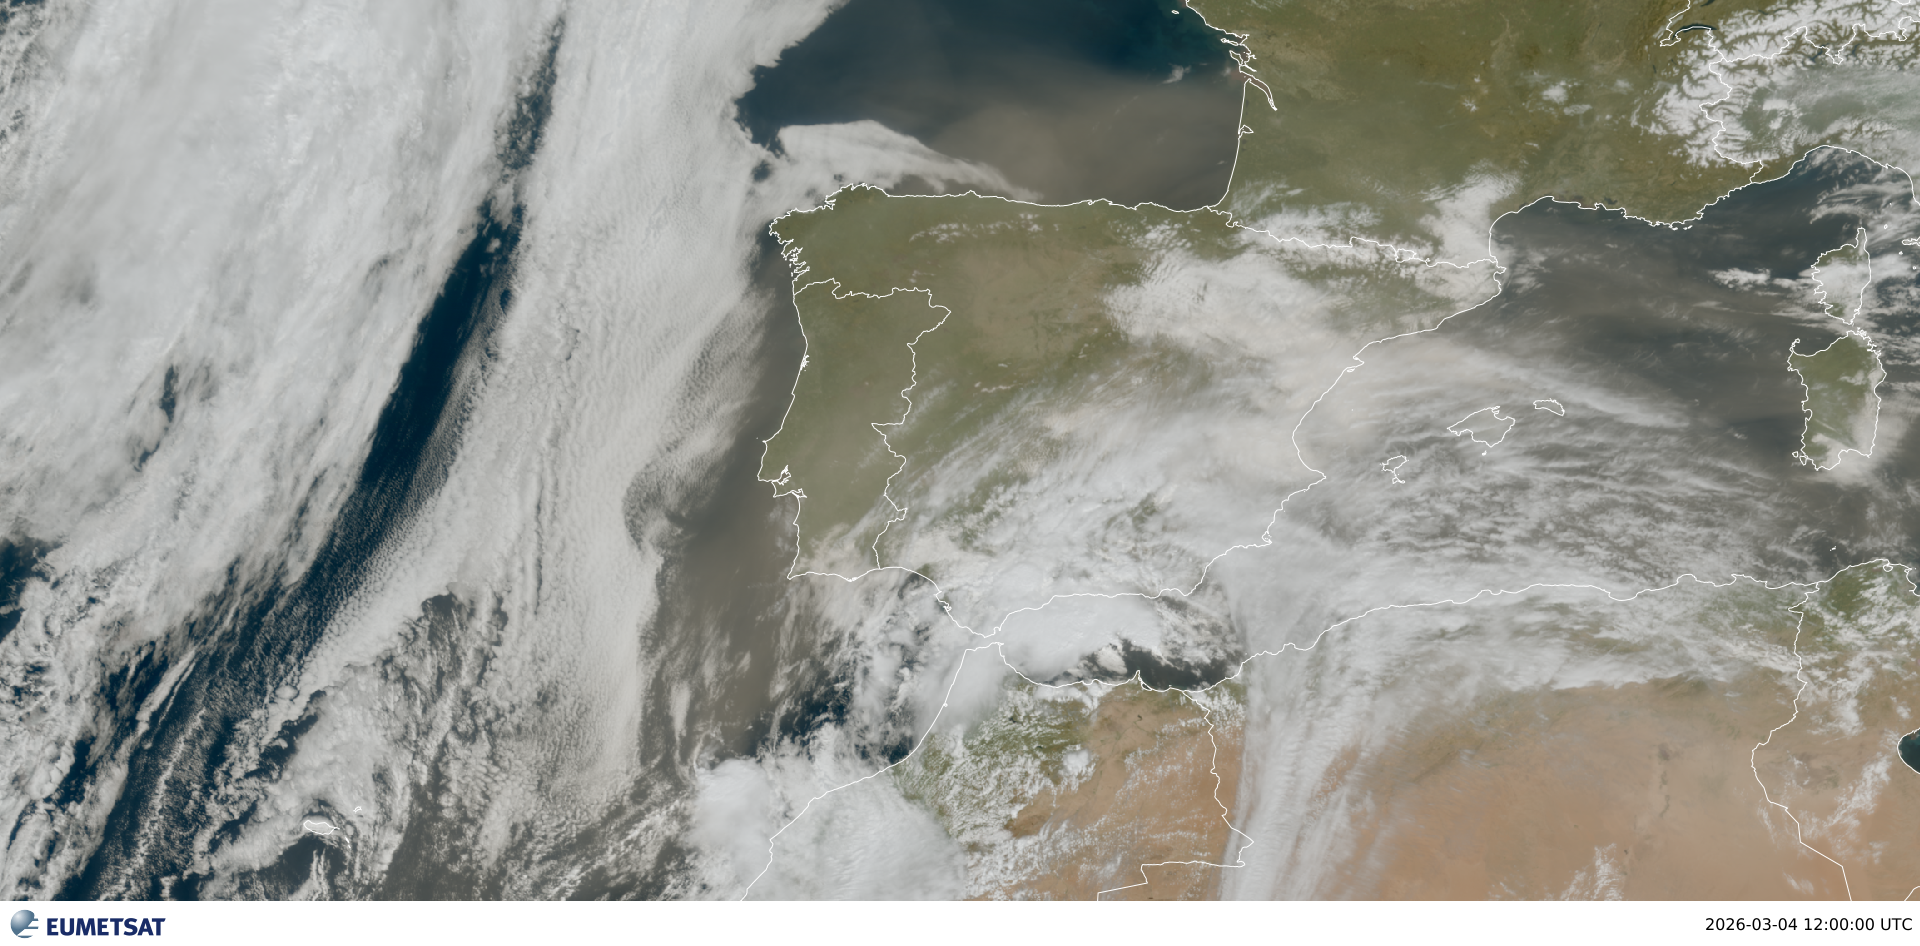
Case study: Dust intrusion - March 2026

Imports
NOTE If Running on Google Colab, you will need to uncomment the following lines to install required packages into the environment.
# Uncomment if running on CoLab
##!pip install cartopy
##!pip install pyhdf
##!pip install cmweather
# Uncomment if running on CoLab
##import pathlib
##from pathlib import Path
##import gdown
##DATA_LINK = "1HMO56nvjmkGyhDYkKPkj8Fd0iET81ved"
##CREATE_BASE = pathlib.Path("./sample_data")
##CREATE_BASE.mkdir(parents=True, exist_ok=True)
##gdown.download(id=DATA_LINK, output=str(CREATE_BASE / "modis.tar.gz"), quiet=False)# Uncomment if running on CoLab
##!gunzip -f ./sample_data/modis.tar.gz
##!tar -xvf ./sample_data/modis.tarimport glob
import numpy as np
import matplotlib.pyplot as plt
import matplotlib.colors as colors
import pandas as pd
import xarray as xr
import cartopy.crs as ccrs
import cartopy.feature as cfeature
import cmweather
from pyhdf.SD import SD, SDCBasemap Creation
Helpful to figure out where in the world we are focusing on first!
# Create a figure layout with a specific map projection
plt.figure(figsize=(12, 6))
ax = plt.axes(projection=ccrs.PlateCarree())

# Add basic map features
ax.coastlines()
ax.stock_img()  # Adds a basic color topography background
ax.gridlines(draw_labels=True)  # Add gridlines with labels
ax.add_feature(cfeature.BORDERS, linewidth=0.5)

ax.set_xlim(-15, 5)
ax.set_ylim(30, 50)

plt.title('Basic World Map Using Cartopy')
plt.show()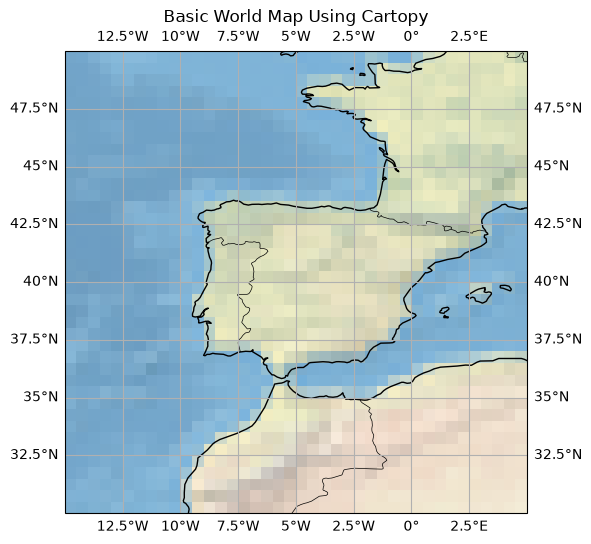
TERRA-MODIS
MODIS Level-3 Daily Global products is used within this analysis.
Data were ordered through the LAADS DAAC and a NASA EarthData login is required.
More information on the MODIS Atmosphere L3 Gridded Product can be found here
terra_files = sorted(glob.glob(".modis/terra/*.hdf"))terra_files['../data/modis/terra/MOD08_D3.A2026061.061.2026062084756.hdf',
'../data/modis/terra/MOD08_D3.A2026062.061.2026063084523.hdf',
'../data/modis/terra/MOD08_D3.A2026063.061.2026064134037.hdf']def read_terra_modis(hdf_file,
lat_min=34,
lat_max=46,
lon_min=-12,
lon_max=5):
def read_sds(hdf, varname):
sds = hdf.select(varname)
data = sds[:].astype(float)
attrs = sds.attributes()
fill_value = attrs.get("_FillValue", None)
valid_range = attrs.get("valid_range", None)
scale_factor = attrs.get("scale_factor", 1.0)
add_offset = attrs.get("add_offset", 0.0)
if fill_value is not None:
data[data == fill_value] = np.nan
if valid_range is not None:
data[(data < valid_range[0]) | (data > valid_range[1])] = np.nan
data = (data - add_offset) * scale_factor
return data
hdf = SD(hdf_file, SDC.READ)
lat = read_sds(hdf, "YDim")
lon = read_sds(hdf, "XDim")
deep_blue_levels = read_sds(hdf, "Deep_Blue_Aerosol_Optical_Depth_Land_Micron_Levels")
deep_blue_aod_land_550 = read_sds(hdf, "Deep_Blue_Aerosol_Optical_Depth_550_Land_Mean")
cth_day_mean = read_sds(hdf, "Cloud_Top_Height_Day_Mean")
deep_blue_angstrom_land = read_sds(hdf, "Deep_Blue_Angstrom_Exponent_Land_Mean")
deep_blue_ssa_land = read_sds(hdf, "Deep_Blue_Single_Scattering_Albedo_Land_Mean")
deep_blue_aod = read_sds(hdf, "Deep_Blue_Aerosol_Optical_Depth_Land_Mean")
cloud_fraction = read_sds(hdf, "Cloud_Fraction_Day_Mean")
ds = xr.Dataset(
data_vars={
"deep_blue_aod_550": (("latitude", "longitude"), deep_blue_aod_land_550),
"cloud_top_height" : (("latitude", "longitude"), cth_day_mean),
"deep_blue_angstrom": (("latitude", "longitude"), deep_blue_angstrom_land),
"deep_blue_ssa": (("wavelength", "latitude", "longitude"), deep_blue_ssa_land),
"deep_blue_aod": (("wavelength", "latitude", "longitude"), deep_blue_aod),
"cloud_fraction": (("latitude", "longitude"), cloud_fraction),
},
coords={
"latitude": (lat),
"longitude": (lon),
"wavelength": (deep_blue_levels),
},
attrs={
"source_file": hdf_file,
}
)
return dsterra_aod_a = read_terra_modis(terra_files[1])
terra_aod_b = read_terra_modis(terra_files[2])terra_aod_bLoading...
fig2 = plt.figure(figsize=(18, 8))

bin_edges = [0.0, 0.1, 0.3, 0.6, 1.5, 5.0]
cmap = plt.get_cmap("YlOrBr")
norm = colors.BoundaryNorm(bin_edges, ncolors=cmap.N)

gs = fig2.add_gridspec(
    nrows=1,
    ncols=3,
    width_ratios=[1, 0.04, 1],
    wspace=0.35
)

mappables = []

axarr = fig2.add_subplot(gs[0, 0], projection=ccrs.PlateCarree())
cax = fig2.add_subplot(gs[0, 1])   # colorbar axis in the middle
axarr2 = fig2.add_subplot(gs[0, 2], projection=ccrs.PlateCarree())

m = terra_aod_a['deep_blue_aod_550'].transpose("longitude", "latitude").plot(transform=ccrs.PlateCarree(),
                                                                             ax=axarr,
                                                                             x="longitude",
                                                                             add_colorbar=False,
                                                                             alpha=0.78,
                                                                             cmap=cmap,
                                                                             vmax=2.0
                                                                             )
mappables.append(m)

# Add basic map features
axarr.coastlines()
#ax.stock_img()  # Adds a basic color topography background
axarr.gridlines(draw_labels=True)  # Add gridlines with labels
axarr.add_feature(cfeature.BORDERS, linewidth=0.5)
axarr.set_xlim(-15, 5)
axarr.set_ylim(30, 50)
axarr.set_facecolor("lightgray")
axarr.set_title("3 March 2026", fontsize=18)

n = terra_aod_b['deep_blue_aod_550'].transpose("longitude", "latitude").plot(transform=ccrs.PlateCarree(),
                                                                             ax=axarr2,
                                                                             x="longitude",
                                                                             add_colorbar=False,
                                                                             vmax=2.0,
                                                                             cmap=cmap,
                                                                             )
mappables.append(n)

cbar = fig2.colorbar(
    m,
    cax=cax,
    orientation="vertical",
)

cbar.set_label("Aerosol Optical Depth")

# Add basic map features
axarr2.coastlines()
#ax.stock_img()  # Adds a basic color topography background
axarr2.gridlines(draw_labels=True)  # Add gridlines with labels
axarr2.add_feature(cfeature.BORDERS, linewidth=0.5)
axarr2.set_xlim(-15, 5)
axarr2.set_ylim(30, 50)
axarr2.set_facecolor("lightgray")
axarr2.set_title("4 March 2026", fontsize=18)

plt.suptitle('MODIS Terra Deep Blue AOD at 550nm', fontsize=20)
/var/folders/7q/czgy7g_j3fb7jw3256f37wrw0000gq/T/ipykernel_31308/3475559743.py:47: UserWarning: Adding colorbar to a different Figure <Figure size 1800x800 with 3 Axes> than <Figure size 1800x800 with 3 Axes> which fig.colorbar is called on.
cbar = fig.colorbar(
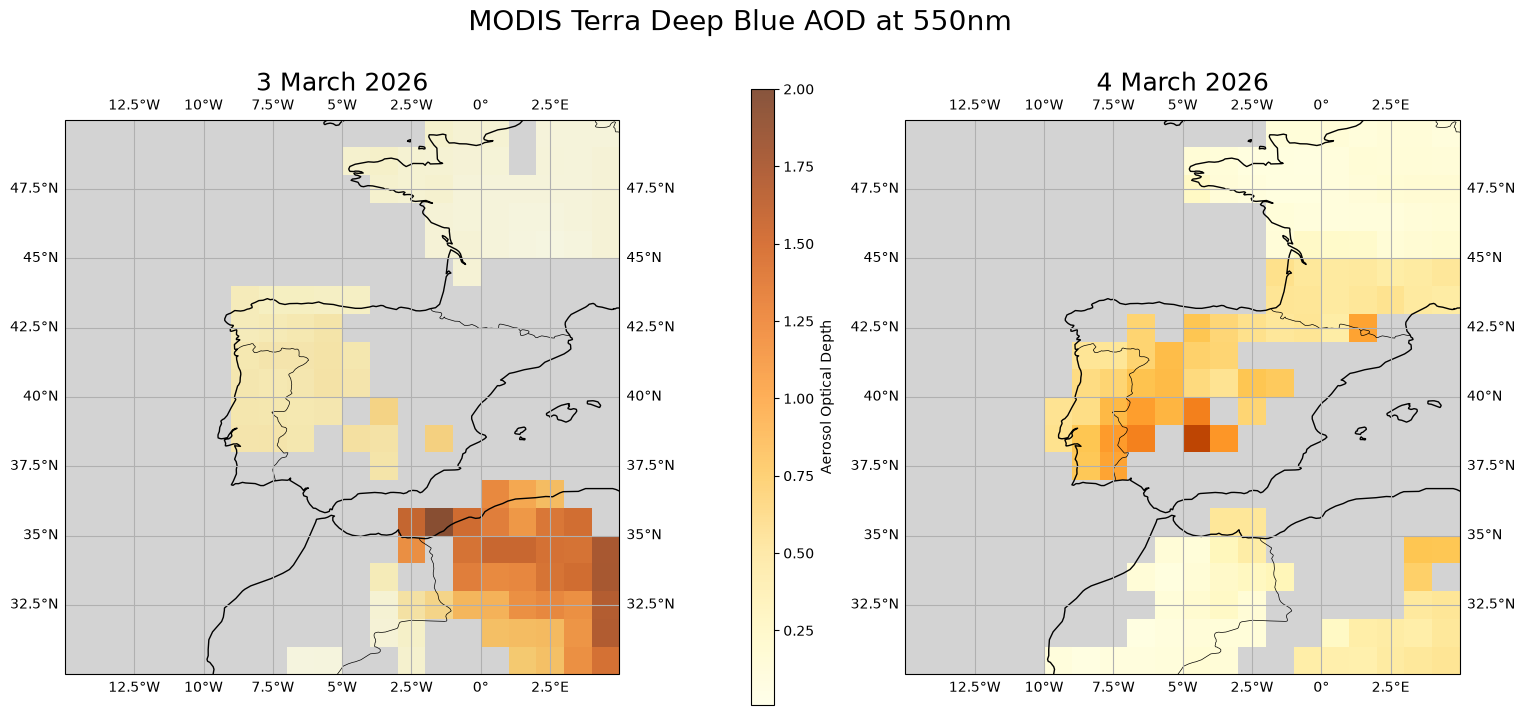
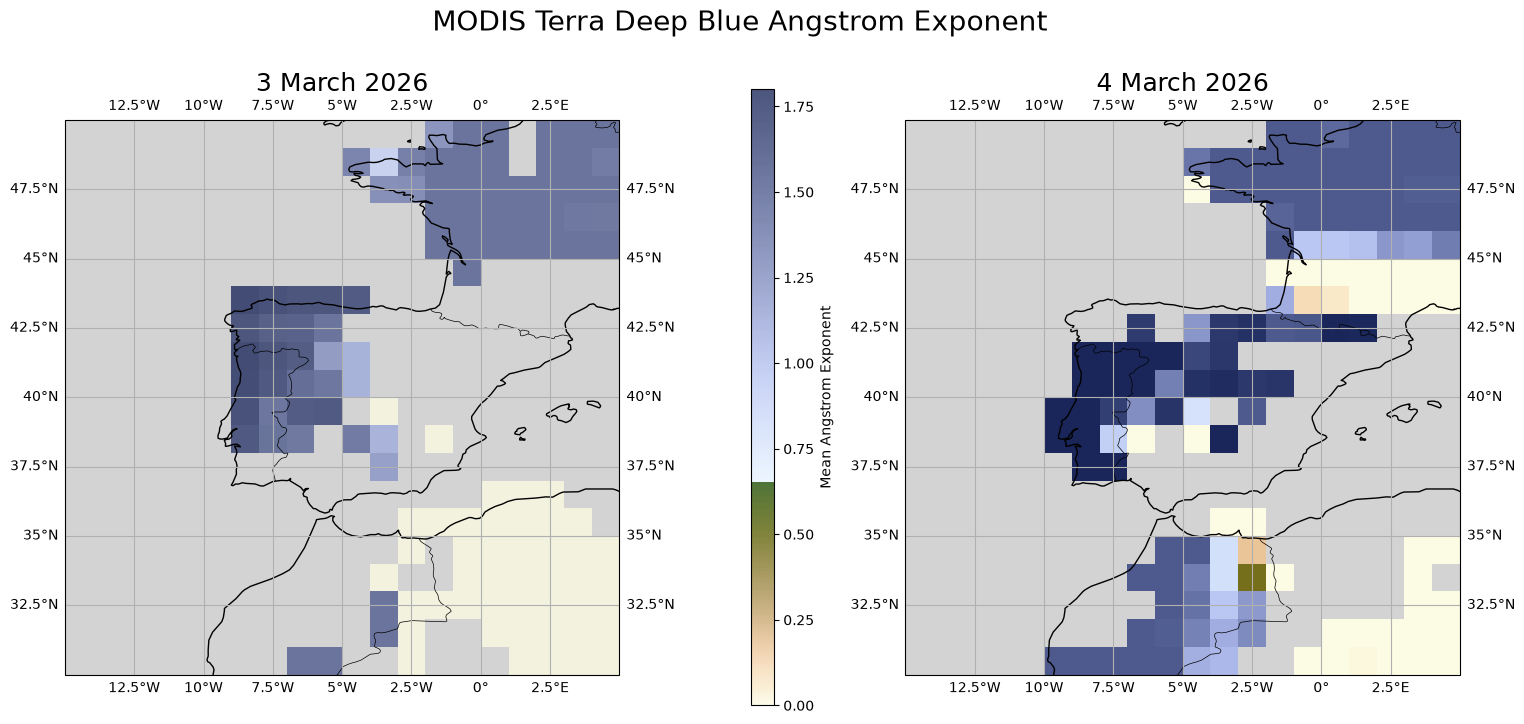
fig2 = plt.figure(figsize=(18, 8))

cmap = plt.get_cmap("CM_depol_r")

gs = fig2.add_gridspec(
    nrows=1,
    ncols=3,
    width_ratios=[1, 0.04, 1],
    wspace=0.35
)

mappables = []

axarr = fig2.add_subplot(gs[0, 0], projection=ccrs.PlateCarree())
cax = fig2.add_subplot(gs[0, 1])   # colorbar axis in the middle
axarr2 = fig2.add_subplot(gs[0, 2], projection=ccrs.PlateCarree())

m = terra_aod_a['deep_blue_angstrom'].transpose("longitude", "latitude").plot(transform=ccrs.PlateCarree(),
                                                                             ax=axarr,
                                                                             x="longitude",
                                                                             add_colorbar=False,
                                                                             alpha=0.78,
                                                                             cmap=cmap,
                                                                             )
mappables.append(m)

# Add basic map features
axarr.coastlines()
#ax.stock_img()  # Adds a basic color topography background
axarr.gridlines(draw_labels=True)  # Add gridlines with labels
axarr.add_feature(cfeature.BORDERS, linewidth=0.5)
axarr.set_xlim(-15, 5)
axarr.set_ylim(30, 50)
axarr.set_facecolor("lightgray")
axarr.set_title("3 March 2026", fontsize=18)

n = terra_aod_b['deep_blue_angstrom'].transpose("longitude", "latitude").plot(transform=ccrs.PlateCarree(),
                                                                             ax=axarr2,
                                                                             x="longitude",
                                                                             add_colorbar=False,
                                                                             cmap=cmap,
                                                                             )
mappables.append(n)

cbar = fig2.colorbar(
    m,
    cax=cax,
    orientation="vertical",
)

cbar.set_label("Mean Angstrom Exponent")

# Add basic map features
axarr2.coastlines()
#ax.stock_img()  # Adds a basic color topography background
axarr2.gridlines(draw_labels=True)  # Add gridlines with labels
axarr2.add_feature(cfeature.BORDERS, linewidth=0.5)
axarr2.set_xlim(-15, 5)
axarr2.set_ylim(30, 50)
axarr2.set_facecolor("lightgray")
axarr2.set_title("4 March 2026", fontsize=18)

plt.suptitle('MODIS Terra Deep Blue Angstrom Exponent', fontsize=20)
/var/folders/7q/czgy7g_j3fb7jw3256f37wrw0000gq/T/ipykernel_31308/843549551.py:43: UserWarning: Adding colorbar to a different Figure <Figure size 1800x800 with 3 Axes> than <Figure size 1800x800 with 3 Axes> which fig.colorbar is called on.
cbar = fig.colorbar(
MODIS-Aqua 3km files
def read_modis_region(hdf_file,
                      aod_variable,
                      lat_min=34,
                      lat_max=46,
                      lon_min=-12,
                      lon_max=5):
    def read_sds(hdf, varname):
        sds = hdf.select(varname)
        data = sds[:].astype(float)
        attrs = sds.attributes()

        fill_value = attrs.get("_FillValue", None)
        valid_range = attrs.get("valid_range", None)
        scale_factor = attrs.get("scale_factor", 1.0)
        add_offset = attrs.get("add_offset", 0.0)

        if fill_value is not None:
            data[data == fill_value] = np.nan

        if valid_range is not None:
            data[(data < valid_range[0]) | (data > valid_range[1])] = np.nan

        data = (data - add_offset) * scale_factor

        return data

    hdf = SD(hdf_file, SDC.READ)

    lat = read_sds(hdf, "Latitude")
    lon = read_sds(hdf, "Longitude")
    aod = read_sds(hdf, aod_variable)

    region_mask = (
        (lat >= lat_min) &
        (lat <= lat_max) &
        (lon >= lon_min) &
        (lon <= lon_max) &
        np.isfinite(aod)
    )

    if not np.any(region_mask):
        return None

    df = pd.DataFrame({
        "file": hdf_file,
        "latitude": lat[region_mask],
        "longitude": lon[region_mask],
        "aod": aod[region_mask],
    })

    return df
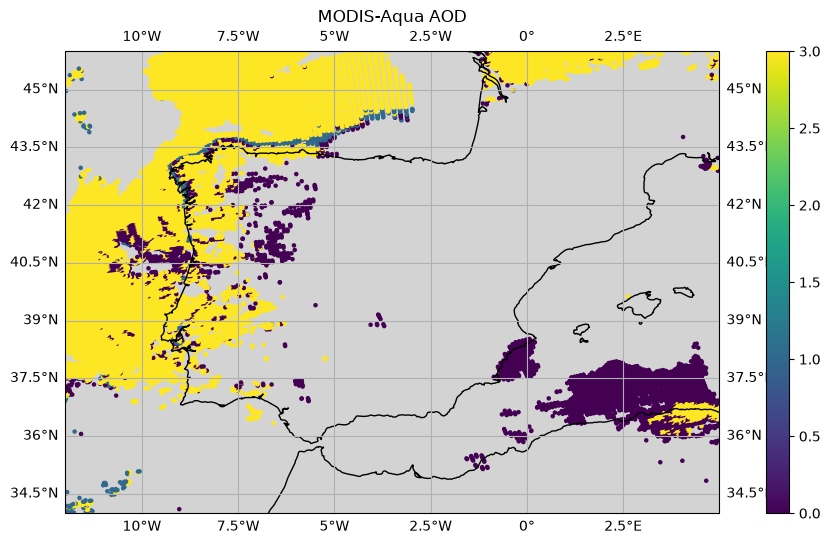
regional_aod = read_modis_region("./modis/aqua/MYD04_3K.A2026062.1405.061.2026063153110.hdf", "Optical_Depth_Land_And_Ocean")regional_aodLoading...
# Create a figure layout with a specific map projection
fig = plt.figure(figsize=(12, 6))
ax = plt.axes(projection=ccrs.PlateCarree())
plt.subplots_adjust(wspace=0.55)  # Adjust space between subplots

sc = ax.scatter(
    regional_aod["longitude"],
    regional_aod["latitude"],
    c=regional_aod["aod"],
    s=5,
    cmap="viridis"
)

# Add basic map features
ax.coastlines()
#ax.stock_img()  # Adds a basic color topography background
ax.gridlines(draw_labels=True)  # Add gridlines with labels

ax.set_xlim(-12, 5)
ax.set_ylim(34, 46)
ax.set_facecolor("lightgray")

cbar = fig.colorbar(
    sc,
    orientation="vertical",
)

plt.title('MODIS-Aqua AOD')
plt.show()
/var/folders/7q/czgy7g_j3fb7jw3256f37wrw0000gq/T/ipykernel_31308/2281277800.py:23: UserWarning: Adding colorbar to a different Figure <Figure size 1200x600 with 2 Axes> than <Figure size 1800x800 with 3 Axes> which fig.colorbar is called on.
cbar = fig.colorbar(